Eddy's Volume Profile New York Breakout (rules + live execution)
I walk through my volume-profile breakout, show a live trade, and recap the earlier test. This video is not a new test.
 ▶ Watch the video
The guide, written out
What this page is
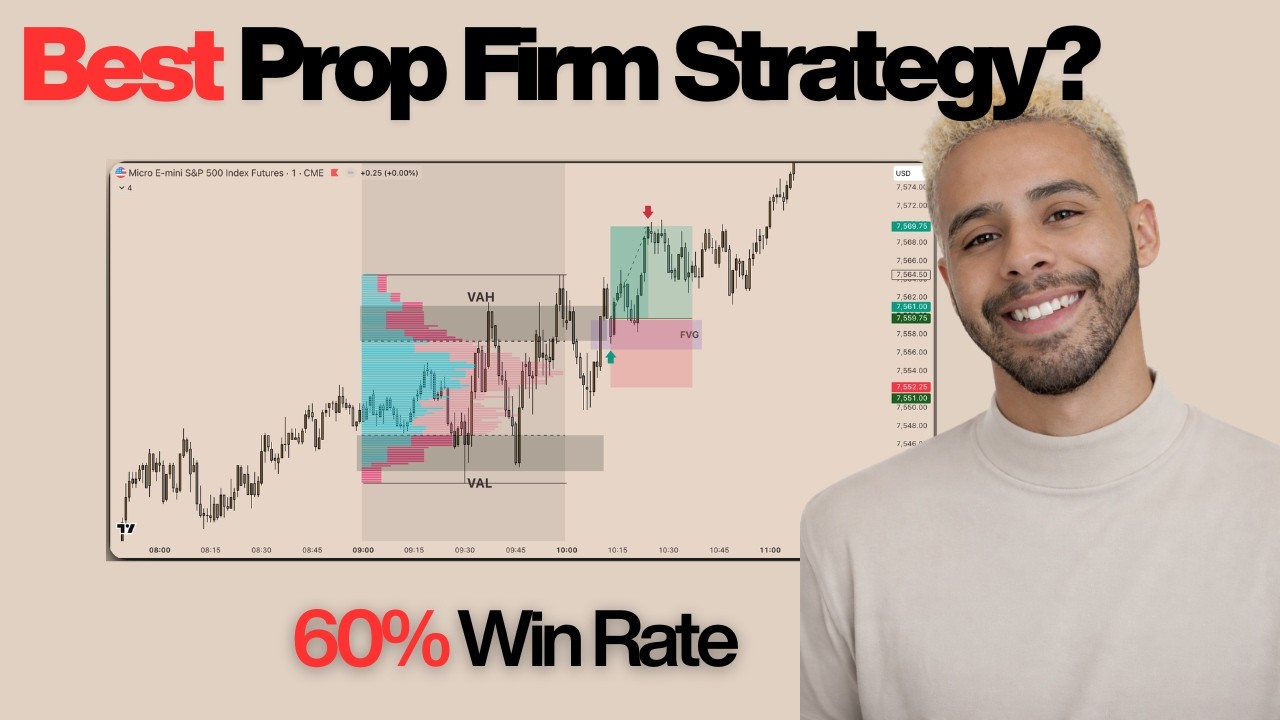
This is the step-by-step guide to my volume profile breakout, with a live trade. It's not a new test. The numbers quoted in the video (a 60% win rate, profit factor almost 2, $8,400 backtested and a 2% biggest drop) come from the earlier 82-trade replay.
I've only tested this on MES (micro S&P 500 futures). I haven't tested gold, MNQ or anything else with it.
Setting up the chart
- Use the 1-minute chart in New York time.
- At 10:00 AM, add TradingView's fixed range volume profile tool from 9:00 AM to the 9:59 candle.
- In its settings, set row size to 1,000, leave the value area at 70%, and turn off the point of control (POC).
What's left on the chart is the value area: the price range where 70% of the 9:00–10:00 volume traded. The top is the value area high, the bottom is the value area low.
The breakout zones
- Draw a box from the value area high to 4 points above it. That's the upper breakout zone.
- Draw a box from the value area low to 4 points below it. That's the lower breakout zone.
The entry
- Price has to be inside the value area first. If it's already above or below at 10:00, wait for it to come back in.
- Wait for price to touch or trade through a breakout zone. It doesn't need to close beyond it.
- Look for displacement: a fair value gap in the move that created the breakout. If there are two, use the first one that appeared in that move.
- Enter one tick beyond the gap: one tick above it for a buy, one tick below it for a sell.
- Stop 7.5 points, target 10 points, on every trade. That's a reward-to-risk of about 1.33.
With a 1.33 reward-to-risk, you break even at about 43%, so the 60% win rate from the backtest leaves a decent cushion.
How this differs from my New York breakout
My first New York breakout uses the plain high and low of the 9:00–10:00 candle and a 1R target. This version uses the value area instead, which ignores the thin wicks at the edges of the hour, and uses a fixed 7.5-point stop and 10-point target so every trade has the same size. That makes it much easier to size for a prop firm account.
If you want to trade it
Take the parts that make sense to you, write your own exact rules, and test them before you put money on them. The live walkthrough shows it in real time, and this page covers which challenge I picked for it and why.
The test
- How I tested
- Guide / walkthrough
- What this is
- This video is not a new backtest.
The numbers
Every trade, charted
85 trades on MES, from the trade journal export for this test.
- Win rate
- 58.8%
- Profit factor
- 1.90
- Net
- $8,313 · 31.5R
- Biggest drop
- -$1,225 · 4.7R
- Longest losing run
- 4 trades
Would these exact trades pass a 50K challenge?
Same trades, same order, same days. Each trade is resized so a 1R loss costs the amount you pick. Rules from each firm’s help pages (check dates are on the prop firms page); evaluation only, payouts not included.
| Firm | Starting on day 1 | Starting on each day in the log |
|---|---|---|
| LucidDaily | Passed on trading day 22 | 48 of 84 start days passed · 0 failed |
| LucidFlex | Passed on trading day 22 | 48 of 84 start days passed · 0 failed |
| Tradeify Select to Flex / Select to Daily | Passed on trading day 22 | 48 of 84 start days passed · 0 failed |
| My Funded Futures Rapid | Passed on trading day 22 | 48 of 84 start days passed · 0 failed |
| My Funded Futures Rapid EOD | Passed on trading day 22 | 48 of 84 start days passed · 0 failed |
| Apex Trader Funding EOD | Passed on trading day 22 | 48 of 84 start days passed · 0 failed |
| Topstep Standard XFA / Consistency XFA | Passed on trading day 22 | 48 of 84 start days passed · 0 failed |
| Take Profit Trader Test to PRO | Passed on trading day 22 | 48 of 84 start days passed · 0 failed |
“Not finished” means the log ended before the target or the drawdown was hit. A short log leaves many late start dates unfinished. Run thousands of random orderings in the simulator →
Trade log
Earlier extended volume-profile backtest; not the live trade in this video
Download PDFDownload endpoint checked 2026-09-22. Contents may differ from the video; see source notes.What’s in the video
- Net pnl
- $8,400 backtested
- Entry rules
- Fixed-range volume profile 9:00-10:00, 4-point breakout zones off value area high/low, entry at first FVG in the breakout leg
- Stop and target
- 7.5-point stop, 10-point target
A note
The numbers in the video are from the earlier test.
Where the numbers come from
Checked Sep 22, 2026. These numbers come from the video and the trade journal export charted above. They are backtest or simulated results, not live trading, and not financial advice.
Original video ↗