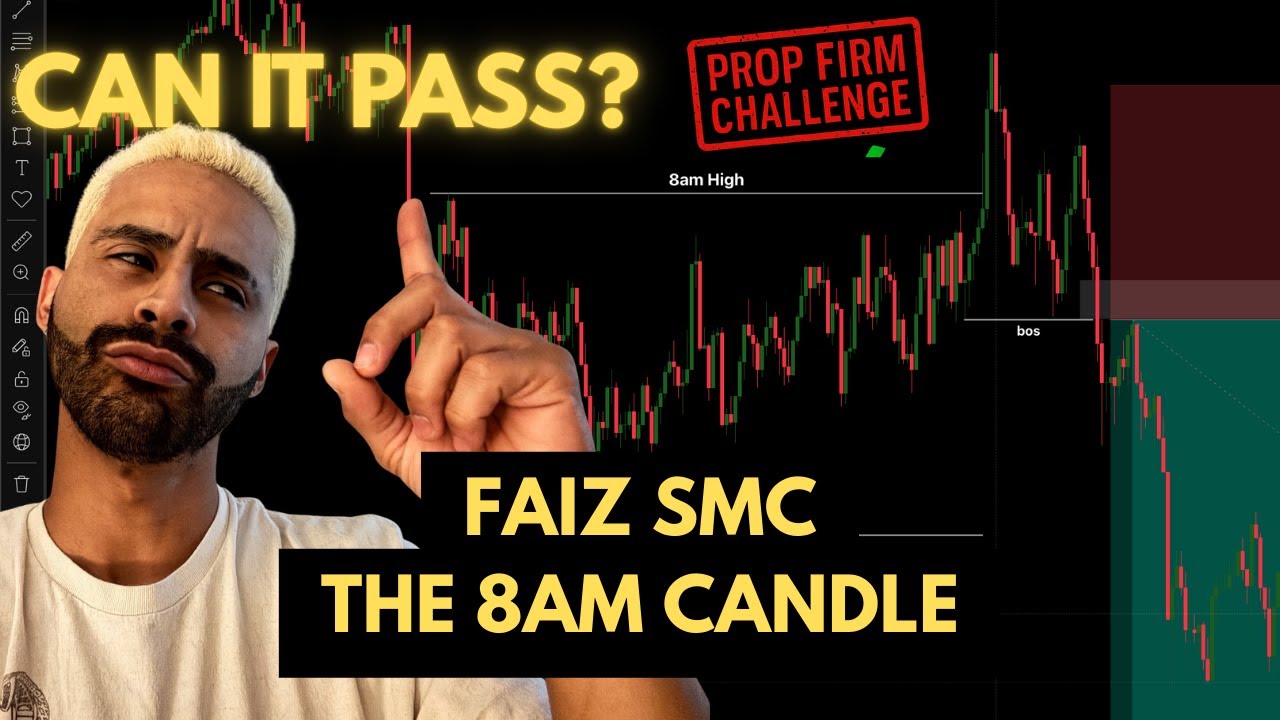
Faiz SMC 8am Candle
It passed the first step, then did not finish the second. The biggest drop was $2,533 (10%).
 ▶ Watch the video
- Trades
- —
- Win rate
- 44%
- Profit factor
- —
- Reward : risk
- —
- Biggest drop
- 10% ($2,533)
- Net result
- —
A dash means the video did not report that number.
Two ways to check this test
EdgeFinder is my app, so it pays me. It never changes a test result. No account needed to open the trades.
My breakdown
The numbers, from my trade journal export
Every figure in this section is calculated from the trade journal export for this test. The full trade list is in the trade replay on this page.
| Market | MNQ (Micro Nasdaq futures) |
| Dates | 2025-01-02 to 2025-08-21 |
| Starting balance | $25,000 |
| Trades | 114 |
| Wins | 48 (42.1%) |
| Net | +$2,656 (+10.6%) |
| Profit factor | 1.33 |
| Worst drawdown | $2,533 (10.1% of start) |
| Longest losing run | 10 trades |
| Month | Trades | Wins | Net |
|---|---|---|---|
| Jan 2025 | 18 | 9 | +$581 |
| Feb 2025 | 17 | 8 | +$444 |
| Mar 2025 | 12 | 6 | +$766 |
| Apr 2025 | 16 | 5 | –$260 |
| May 2025 | 13 | 2 | –$1,152 |
| Jun 2025 | 15 | 7 | +$1,109 |
| Jul 2025 | 8 | 3 | +$137 |
| Aug 2025 | 15 | 8 | +$1,032 |
The first three months were steady. April and May lost $1,412 between them (May won only 2 of 13), and that is where phase 2 stalled. June and August recovered most of it.
The strategy in plain English
Faiz SMC says "this one candle can change your life". The candle is the 8:00 AM hourly candle, New York time.
- At 9:00 AM, wait for the 8:00 AM hourly candle to close. Mark its high and low. These are the levels where stop orders are likely sitting.
- Drop to the 1-minute chart and draw a line at 9:30 AM. You can only trade after 9:30.
- Wait for price to sweep (go beyond) the high or the low after 9:30.
- Wait for a market structure shift: price breaks the most recent swing point in the other direction and closes back inside the 8 AM range.
- Enter on a pullback to any "PD array": a fair value gap, an order block or a breaker block.
- Stop beyond the sweep. Target 2R.
Step 5 is where judgment comes in. There's usually more than one valid entry zone, and they give different results. In the video I usually picked the zone where several lined up.
I also managed winners: partial profit at 2R and the stop moved to break-even. That brought the average win to about 1.6R.
How I tested it
I replayed from January to August and tracked it against FTMO's two-phase rules.
What happened
- Phase 1 passed, in about three months.
- Phase 2 didn't finish. It neither passed nor failed by August.
- 44% win rate, as reported in the video. The trade log counts each partial close as its own row, 114 in all, which works out to 42%.
- biggest drop $2,533 (10%) from the trade log, right at FTMO's 10% limit
Month by month: just under +2% in January, +3% in March, then −1% in April and −4% in May. The spring months gave back much of what the first quarter made.
What this shows
At an average win of about 1.6R, the break-even win rate is about 38%. A 42–44% win rate is above that, but not by much, and a 10% drop against a 10% limit leaves no room at all. It's a strategy with a small edge and a lot of judgment, which is a hard combination: your results depend heavily on which entry zone you pick.
Takeaway
If you like Faiz's approach, the most useful thing you can do is pin down step 5. Pick one entry type (for example, only fair value gaps) and test that alone. My SMC inverse FVG test is an example of a similar idea with fixed rules that held up over 100 trades.
The test
- How I tested
- Manual replay
- When
- January to August
- Market
- Not said in the video
- Trades
- More than one stretch of trades. See below.
- Risk per trade
- Not said in the video
- Fees
- Not said in the video
The numbers
Every trade, charted
114 trades on MNQ, from the trade journal export for this test.
- Win rate
- 42.1%
- Profit factor
- 1.33
- Net
- $2,656 · 17.5R
- Biggest drop
- -$2,533 · 19.2R
- Longest losing run
- 10 trades
Would these exact trades pass a 50K challenge?
Same trades, same order, same days. Each trade is resized so a 1R loss costs the amount you pick. Rules from each firm’s help pages (check dates are on the prop firms page); evaluation only, payouts not included.
| Firm | Starting on day 1 | Starting on each day in the log |
|---|---|---|
| LucidDaily | Passed on trading day 28 | 17 of 62 start days passed · 20 failed |
| LucidFlex | Passed on trading day 28 | 17 of 62 start days passed · 20 failed |
| Tradeify Select to Flex / Select to Daily | Passed on trading day 28 | 17 of 62 start days passed · 20 failed |
| My Funded Futures Rapid | Passed on trading day 28 | 17 of 62 start days passed · 20 failed |
| My Funded Futures Rapid EOD | Passed on trading day 28 | 16 of 62 start days passed · 20 failed |
| Apex Trader Funding EOD | Passed on trading day 28 | 17 of 62 start days passed · 20 failed |
| Topstep Standard XFA / Consistency XFA | Passed on trading day 28 | 17 of 62 start days passed · 20 failed |
| Take Profit Trader Test to PRO | Passed on trading day 28 | 17 of 62 start days passed · 20 failed |
“Not finished” means the log ended before the target or the drawdown was hit. A short log leaves many late start dates unfinished. Run thousands of random orderings in the simulator →
Trade log
All 114 positions from the replay, January to August 2025
Open trade log in EdgeFinderOpens every trade in EdgeFinder, the app I built. No account needed.More from the test
- Rules
- FTMO two-phase
- Outcome
- Passed phase 1 (~3 months), did not finish phase 2
- Average RR
- ~1.6 after partials at 2R and stop to break-even
- Test window
- January to August
- Monthly
- Just under +2% Jan, +3% Mar, -1% Apr, -4% May
A note
When the video compares other firms, that is not a full replay of each firm’s rules. The video reports a 44% win rate. The trade log lists each partial close as its own row, 114 in all, and works out to 42%.
Where the numbers come from
Checked Sep 22, 2026. These numbers come from the video and the trade journal export charted above. They are backtest or simulated results, not live trading, and not financial advice.
Original video ↗