Trade with Pat 1 Candle Scalping Strategy
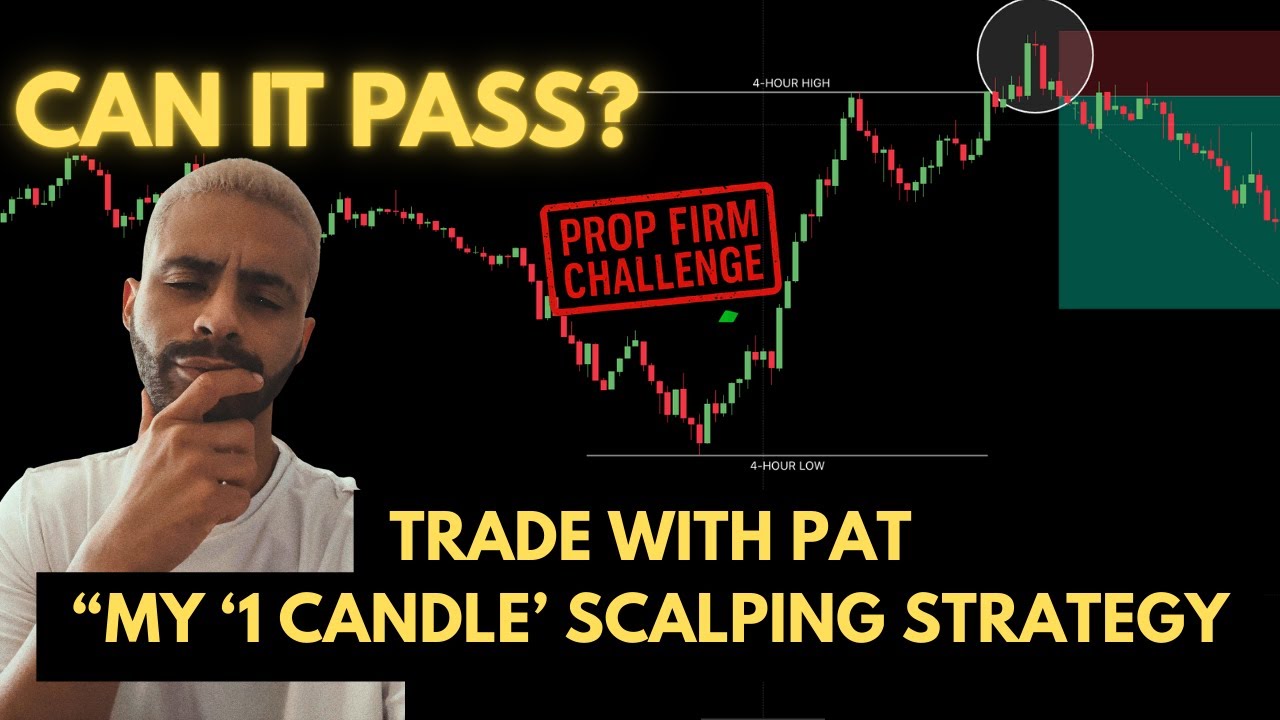
The test passed an FTMO-style challenge. The biggest drop was $700 (7%). I had to use some judgment on where to put the stop.
 ▶ Watch the video
- Trades
- 58
- Win rate
- 43%
- Profit factor
- —
- Reward : risk
- 2R
- Biggest drop
- 7% ($700)
- Net result
- —
A dash means the video did not report that number.
Two ways to check this test
EdgeFinder is my app, so it pays me. It never changes a test result. No account needed to open the trades.
My breakdown
The numbers, from my trade journal export
Every figure in this section is calculated from the trade journal export for this test. The full trade list is in the trade replay on this page.
| Market | EURUSD |
| Dates | 2025-01-07 to 2025-05-20 |
| Starting balance | $10,000 |
| Trades | 58 |
| Wins | 25 (43.1%) |
| Net | +$1,699 (+17.0%) |
| Profit factor | 1.51 |
| Worst drawdown | $700 (7.0% of start) |
| Longest losing run | 7 trades |
| Month | Trades | Wins | Net |
|---|---|---|---|
| Jan 2025 | 13 | 7 | +$802 |
| Feb 2025 | 13 | 6 | +$499 |
| Mar 2025 | 11 | 3 | –$200 |
| Apr 2025 | 11 | 3 | –$200 |
| May 2025 | 10 | 6 | +$798 |
January and February did the work (+$1,301 together). March and April both lost $200 while winning only 3 of 11 trades each, and May recovered it. The account never went more than $200 below its starting balance.
The strategy in plain English
Trade with Pat calls this one candle strategy "stupid simple". It's built on the idea that the first 4-hour candle of the day is where the market builds up orders, and the move after it is where you trade. The rules I tested:
- Trade EURUSD. Use the 4-hour chart for context and the 5-minute chart for entries.
- Mark the high and low of the 1:00 AM to 5:00 AM New York 4-hour candle.
- On the 5-minute chart, wait for three or four candles to close outside that range. Pat calls this the fake-out.
- When a candle closes back inside the range, enter at market in the opposite direction.
- Stop beyond the candles that went outside the range.
- Target 2R. (Pat also mentions targeting a fair value gap or the other side of the range. I used a fixed 2R to keep it mechanical.)
- Risk 0.5% to 1% a trade.
Pat doesn't give a cut-off time, so I stopped taking trades at 11:00 AM New York, when London closes and EURUSD usually goes quiet.
How I tested it
I replayed EURUSD in FX Replay on a $10,000 account, starting January 2 (viewers asked me to use recent data) and running to May 20. I tracked it against FTMO rules: a 10% target in phase 1 and 5% in phase 2.
About 80% of the rules are mechanical. The judgment call is the stop: "beyond the candles that went outside" leaves room for interpretation, so another trader could take slightly different trades.
What happened
It passed. Over 58 trades:
- 25 wins, 33 losses, a 43% win rate
- every winner paid 2R
- biggest drop $700 (7%) from the trade log
At 2R the break-even win rate is about 33%, so 43% gives a real cushion. The drawdown is the part to respect: a $700 (7%) drop is close to FTMO's 10% limit, so there wasn't a lot of room to spare.
Takeaway
This is a strategy where the idea holds up better than most: a clear range, a clear fake-out, and a fixed target. The weak spot is the stop. If you trade it, decide exactly where your stop goes (for example, a fixed number of pips above the highest candle outside the range) and write it down before you start, so your results are repeatable. Then size so a 7–8% drop doesn't put you near your firm's limit. The drawdown rules guide shows how to check that.
The test
- How I tested
- Manual replay
- When
- January to May 20
- Market
- Not said in the video
- Trades
- 58
- Risk per trade
- Not said in the video
- Fees
- Not said in the video
The numbers
Every trade, charted
58 trades on EURUSD, from the trade journal export for this test.
- Win rate
- 43.1%
- Profit factor
- 1.51
- Net
- $1,699 · 17.0R
- Biggest drop
- -$700 · 7.0R
- Longest losing run
- 7 trades
Would these exact trades pass a 50K challenge?
Same trades, same order, same days. Each trade is resized so a 1R loss costs the amount you pick. Rules from each firm’s help pages (check dates are on the prop firms page); evaluation only, payouts not included.
| Firm | Starting on day 1 | Starting on each day in the log |
|---|---|---|
| LucidDaily | Passed on trading day 30 | 4 of 55 start days passed · 0 failed |
| LucidFlex | Passed on trading day 30 | 4 of 55 start days passed · 0 failed |
| Tradeify Select to Flex / Select to Daily | Passed on trading day 30 | 4 of 55 start days passed · 0 failed |
| My Funded Futures Rapid | Passed on trading day 30 | 4 of 55 start days passed · 0 failed |
| My Funded Futures Rapid EOD | Passed on trading day 30 | 4 of 55 start days passed · 0 failed |
| Apex Trader Funding EOD | Passed on trading day 30 | 4 of 55 start days passed · 0 failed |
| Topstep Standard XFA / Consistency XFA | Passed on trading day 30 | 4 of 55 start days passed · 0 failed |
| Take Profit Trader Test to PRO | Passed on trading day 30 | 4 of 55 start days passed · 0 failed |
“Not finished” means the log ended before the target or the drawdown was hit. A short log leaves many late start dates unfinished. Run thousands of random orderings in the simulator →
Trade log
All 58 trades from the challenge replay
Open trade log in EdgeFinderOpens every trade in EdgeFinder, the app I built. No account needed.More from the test
- Rules
- FTMO (10% phase 1 / 5% phase 2)
- Test window
- January to May 20
- Mechanical share
- ~80% mechanical
A note
Because the stop is a judgment call, someone else might not take the same trades. Drawdown is from the trade log: $700, 7% of the starting balance.
Where the numbers come from
Checked Sep 22, 2026. These numbers come from the video and the trade journal export charted above. They are backtest or simulated results, not live trading, and not financial advice.
Original video ↗