Faiz SMC Midas Model
The first month was up about 7%. The next months gave it back. After four months it was not a lasting challenge result.
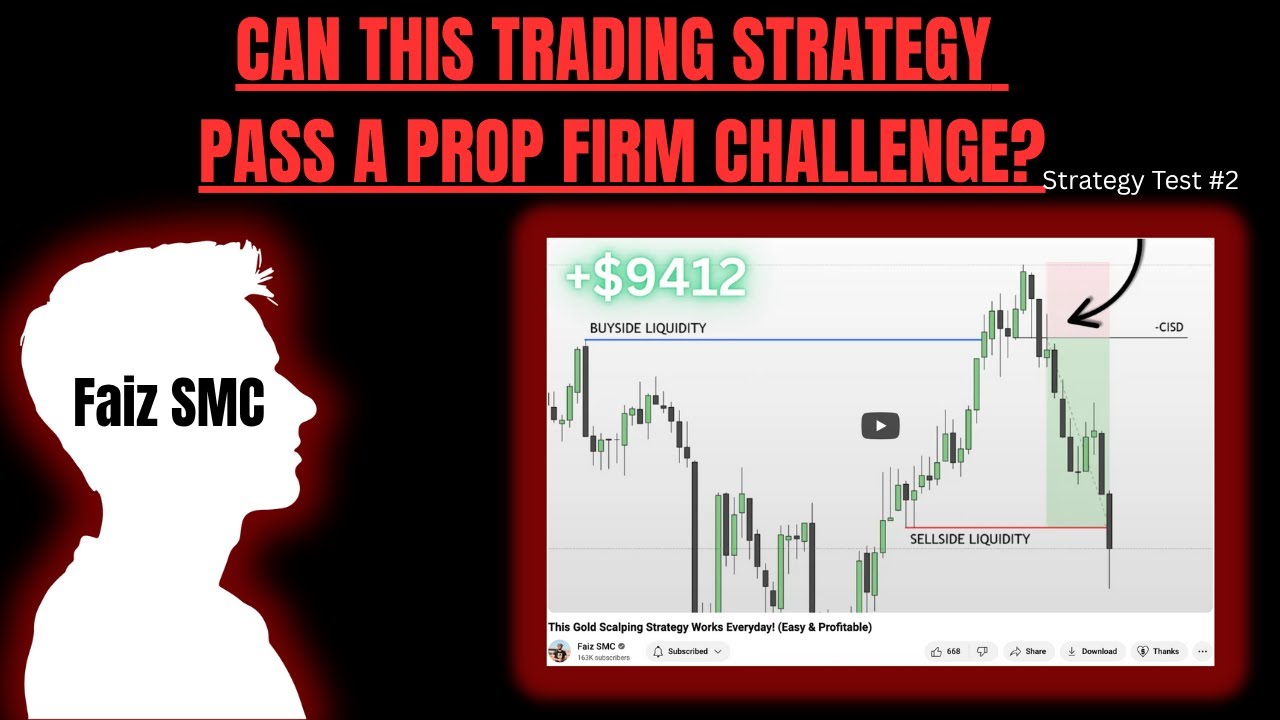 ▶ Watch the video
- Trades
- 71
- Win rate
- 33%
- Profit factor
- —
- Reward : risk
- —
- Biggest drop
- 3%
- Net result
- —
A dash means the video did not report that number.
Two ways to check this test
EdgeFinder is my app, so it pays me. It never changes a test result. No account needed to open the trades.
My breakdown
The strategy in plain English
Faiz SMC calls this gold scalping strategy easy, profitable, and one that works every day. It trades gold during the Asian session, with two possible setups: one at 8:00 PM and one at 9:00 PM New York time.
The 8:00 PM setup (the main one):
- Before 8:00 PM, on the 15-minute chart, mark the most recent high and low.
- After 8:00 PM, drop to the 1-minute chart and wait for price to sweep one of them.
- Wait for a market structure shift with displacement: a strong push the other way that breaks the last swing and leaves a fair value gap.
- Enter in the fair value gap (or an order block). Stop beyond the sweep. Target 2R.
The 9:00 PM setup is only allowed if two things are true: nothing was swept between 8:00 and 9:00, and any trade from the 8:00 setup is already closed.
I put the rules in a checklist and ticked it off on every trade, so I could show I followed them.
How I tested it
I replayed gold from November 2018 to February 2019 and compared it against three firms' profit targets: 6% at Apex, 13% at The5ers and 15% at FTMO.
What happened
- 24 wins, 47 losses, about a 33% win rate
- longest losing streak 8
- the first month was up about 7%, enough for Apex's 6% target
- the following months gave that back
The video reports a 3% drawdown, but that's how far the account fell below where it started. Measured from its highest point, the biggest drop in the trade log is about 9%, which is the number that matters for a trailing drawdown.
What this shows
At 2R you break even around 33%, so a 33% win rate is right on the line: roughly no edge. The first month looked like a pass, and if I'd stopped there, this page would say "passed". Over four months, it didn't hold.
This is also a good example of why "it passed" depends on the firm. A 6% target at one firm was hit. The 13% and 15% targets at the others weren't.
Takeaway
If you trade this, test more than a month, and measure your drawdown from your highest balance, not your starting balance. Most prop firms measure it that way. My guide to drawdown rules explains the difference, and the results page has gold strategies that held up better, like RamtinFX's daily-candle Fibonacci.
The test
- How I tested
- Manual replay
- When
- November 2018–February 2019
- Market
- Gold
- Trades
- More than one stretch of trades. See below.
- Risk per trade
- Not said in the video
- Fees
- Not said in the video
The numbers
Every trade, charted
71 trades on XAUUSD, from the trade journal export for this test.
- Win rate
- 33.8%
- Profit factor
- 1.00
- Net
- $4 · -0.7R
- Biggest drop
- -$998 · 10.7R
- Longest losing run
- 8 trades
Would these exact trades pass a 50K challenge?
Same trades, same order, same days. Each trade is resized so a 1R loss costs the amount you pick. Rules from each firm’s help pages (check dates are on the prop firms page); evaluation only, payouts not included.
| Firm | Starting on day 1 | Starting on each day in the log |
|---|---|---|
| LucidDaily | Failed on trading day 38 | 0 of 69 start days passed · 21 failed |
| LucidFlex | Failed on trading day 38 | 0 of 69 start days passed · 21 failed |
| Tradeify Select to Flex / Select to Daily | Failed on trading day 38 | 0 of 69 start days passed · 21 failed |
| My Funded Futures Rapid | Failed on trading day 38 | 0 of 69 start days passed · 21 failed |
| My Funded Futures Rapid EOD | Failed on trading day 38 | 0 of 69 start days passed · 21 failed |
| Apex Trader Funding EOD | Failed on trading day 38 | 0 of 69 start days passed · 21 failed |
| Topstep Standard XFA / Consistency XFA | Failed on trading day 38 | 0 of 69 start days passed · 21 failed |
| Take Profit Trader Test to PRO | Failed on trading day 38 | 0 of 69 start days passed · 21 failed |
“Not finished” means the log ended before the target or the drawdown was hit. A short log leaves many late start dates unfinished. Run thousands of random orderings in the simulator →
Trade log
All 71 trades from the four-month replay
Open trade log in EdgeFinderOpens every trade in EdgeFinder, the app I built. No account needed.More from the test
- Instrument
- Gold
- Test window
- November 2018–February 2019
- Reported win rate
- 33%
- Max consecutive losses
- 8
A note
Hitting one firm’s profit goal does not mean every firm’s rules were met. The 3% drawdown from the video is how far the account fell below where it started. Measured from its highest point, the biggest drop in the trade log is about 9%.
Where the numbers come from
Checked Sep 22, 2026. These numbers come from the video and the trade journal export charted above. They are backtest or simulated results, not live trading, and not financial advice.
Original video ↗