Pro Real Algos Break and Bounce
Both original versions lost money. Four long-only versions made money over the full history, but the one I picked then lost money in 2023–2024.
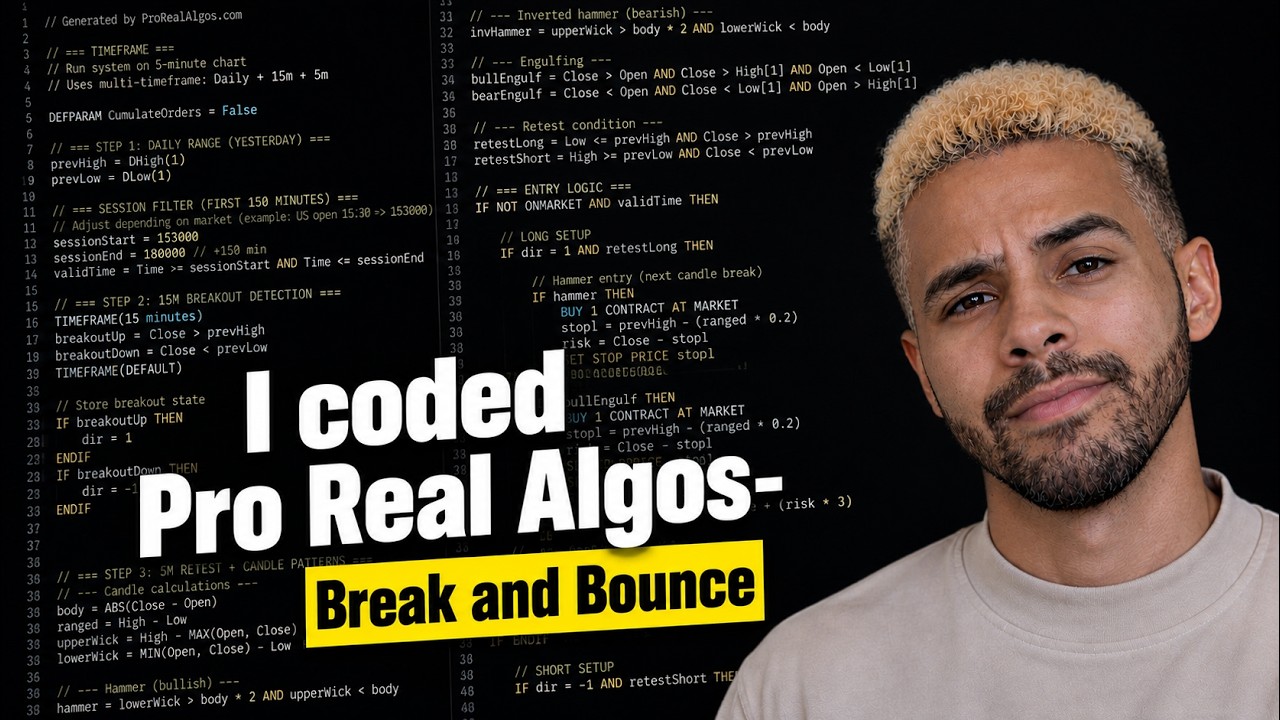 ▶ Watch the video
- Trades
- 395
- Win rate
- —
- Profit factor
- 0.98
- Reward : risk
- —
- Biggest drop
- —
- Net result
- -$3,380
A dash means the video did not report that number.
Two ways to check this test
My breakdown
The claim
Pro Real Algos' Break and Bounce video has hundreds of thousands of views. In it, he shows an algorithm with a 70% win rate and a 1.6 profit factor ($1.60 made for every $1 lost). He also links his code in the description. So I coded the strategy and ran it on more than 10 years of NQ futures.
The strategy in plain English
- Mark yesterday's high and low.
- After the open, wait for a 15-minute candle to close outside that range. Above means longs, below means shorts.
- On the 5-minute chart, wait for price to come back and retest the breakout level.
- At the retest, look for a hammer or engulfing candle. That reversal is the entry.
- Stop beyond the reversal candle. Target 3R.
- If there's no setup in the first 2.5 hours, there's no trade that day.
The video and the code don't match
When I downloaded his code, I found it trades a slightly different strategy from the one he teaches:
- Entry: the video says wait for price to break the hammer's high. His live example enters as soon as the hammer closes. The code enters at market once the pattern forms. That's three different entries.
- Stop: the video puts it beyond the reversal candle. The code works it out from the previous day's level and part of the candle's range.
- Target: mostly 3R, but one example in the video uses 2R. The code uses 3R.
Different entries and stops mean different trades, so I tested both versions.
What happened
- The video's rules: 395 trades, −$3,380, about $0.98 back for every $1 lost.
- His downloadable code: 229 trades, −$3,860, about $0.94 back for every $1 lost.
Neither came close to a 70% win rate or a 1.6 profit factor. Commission and slippage were included in both.
Could a tweak fix it?
I tried variations. Four long-only versions made money over the full history. Then I did the honest check: I picked the best version using only 2019 to 2022 (a hammer close entry, 3R target, longs only). On those years it made about +$11,000 over 89 trades, with $1.46 made per $1 lost.
Then I ran that exact version on 2023 to 2024, data it had never seen. It lost about $10,000 over 41 trades, with only $0.47 back per $1 lost.
That's the trap with optimizing: a version that looks great on old data can fall apart on new data.
Takeaway
Neither the strategy in the video nor the code he gives away made money in my test. If you're testing any strategy with downloadable code, check that the code actually trades the rules you were taught, because often it doesn't. And if you tweak a strategy until it works, always test the winner on years you didn't use to pick it. My guide on how I backtest explains why.
The test
- How I tested
- Coded backtest
- When
- Not said in the video
- Market
- NQ futures
- Trades
- More than one stretch of trades. See below.
- Risk per trade
- Not said in the video
- Fees
- Commission and slippage included; exact rates not stated in transcript
Trade log
I have not published a trade log for this test. The numbers on this page come from the results shown in the video.
More from the test
- Video rules
- 395 trades; -$3,380; PF 0.98
- Downloaded code rules
- 229 trades; -$3,860; PF 0.94
- Selection sample
- 2019–2022: hammer-close / 3R / long-only; 89 trades; approximately +$11,000; PF 1.46
- Later check
- 2023–2024: 41 trades; approximately -$10,000; PF 0.47
- Instrument
- NQ futures
- Costs
- Commission and slippage included; exact rates not stated in transcript
A note
Making money on old data is not the same as holding up later.
Where the numbers come from
Checked Sep 22, 2026. These numbers come from the video. They are backtest or simulated results, not live trading, and not financial advice.
Original video ↗